
Analyzing motor vehicle collision data is a staple of our work. When a client in Los Angeles expressed interest in working with us, we decided to take aim at the issue of pedestrian safety. Using the freshest available California crash data (nearly 500,000 crashes in total), we isolated all crashes involving pedestrians in Los Angeles County.
We had two specific questions in mind: Where are pedestrians most often struck by motor vehicles and when.
Visualizations, Data Elements and Results
The results? Widespread coverage throughout Los Angeles County, including a television spot on KTLA, a digital story on ABC 7 and local outlets such as the Santa Monica Lookout, and the Signal Tribune.
We answered “where” with an interactive map that allows readers and visitors to see exactly where each pedestrian collision occurred. Each circle represents a pedestrian crash and the circle size is determined by the number of pedestrian injuries.
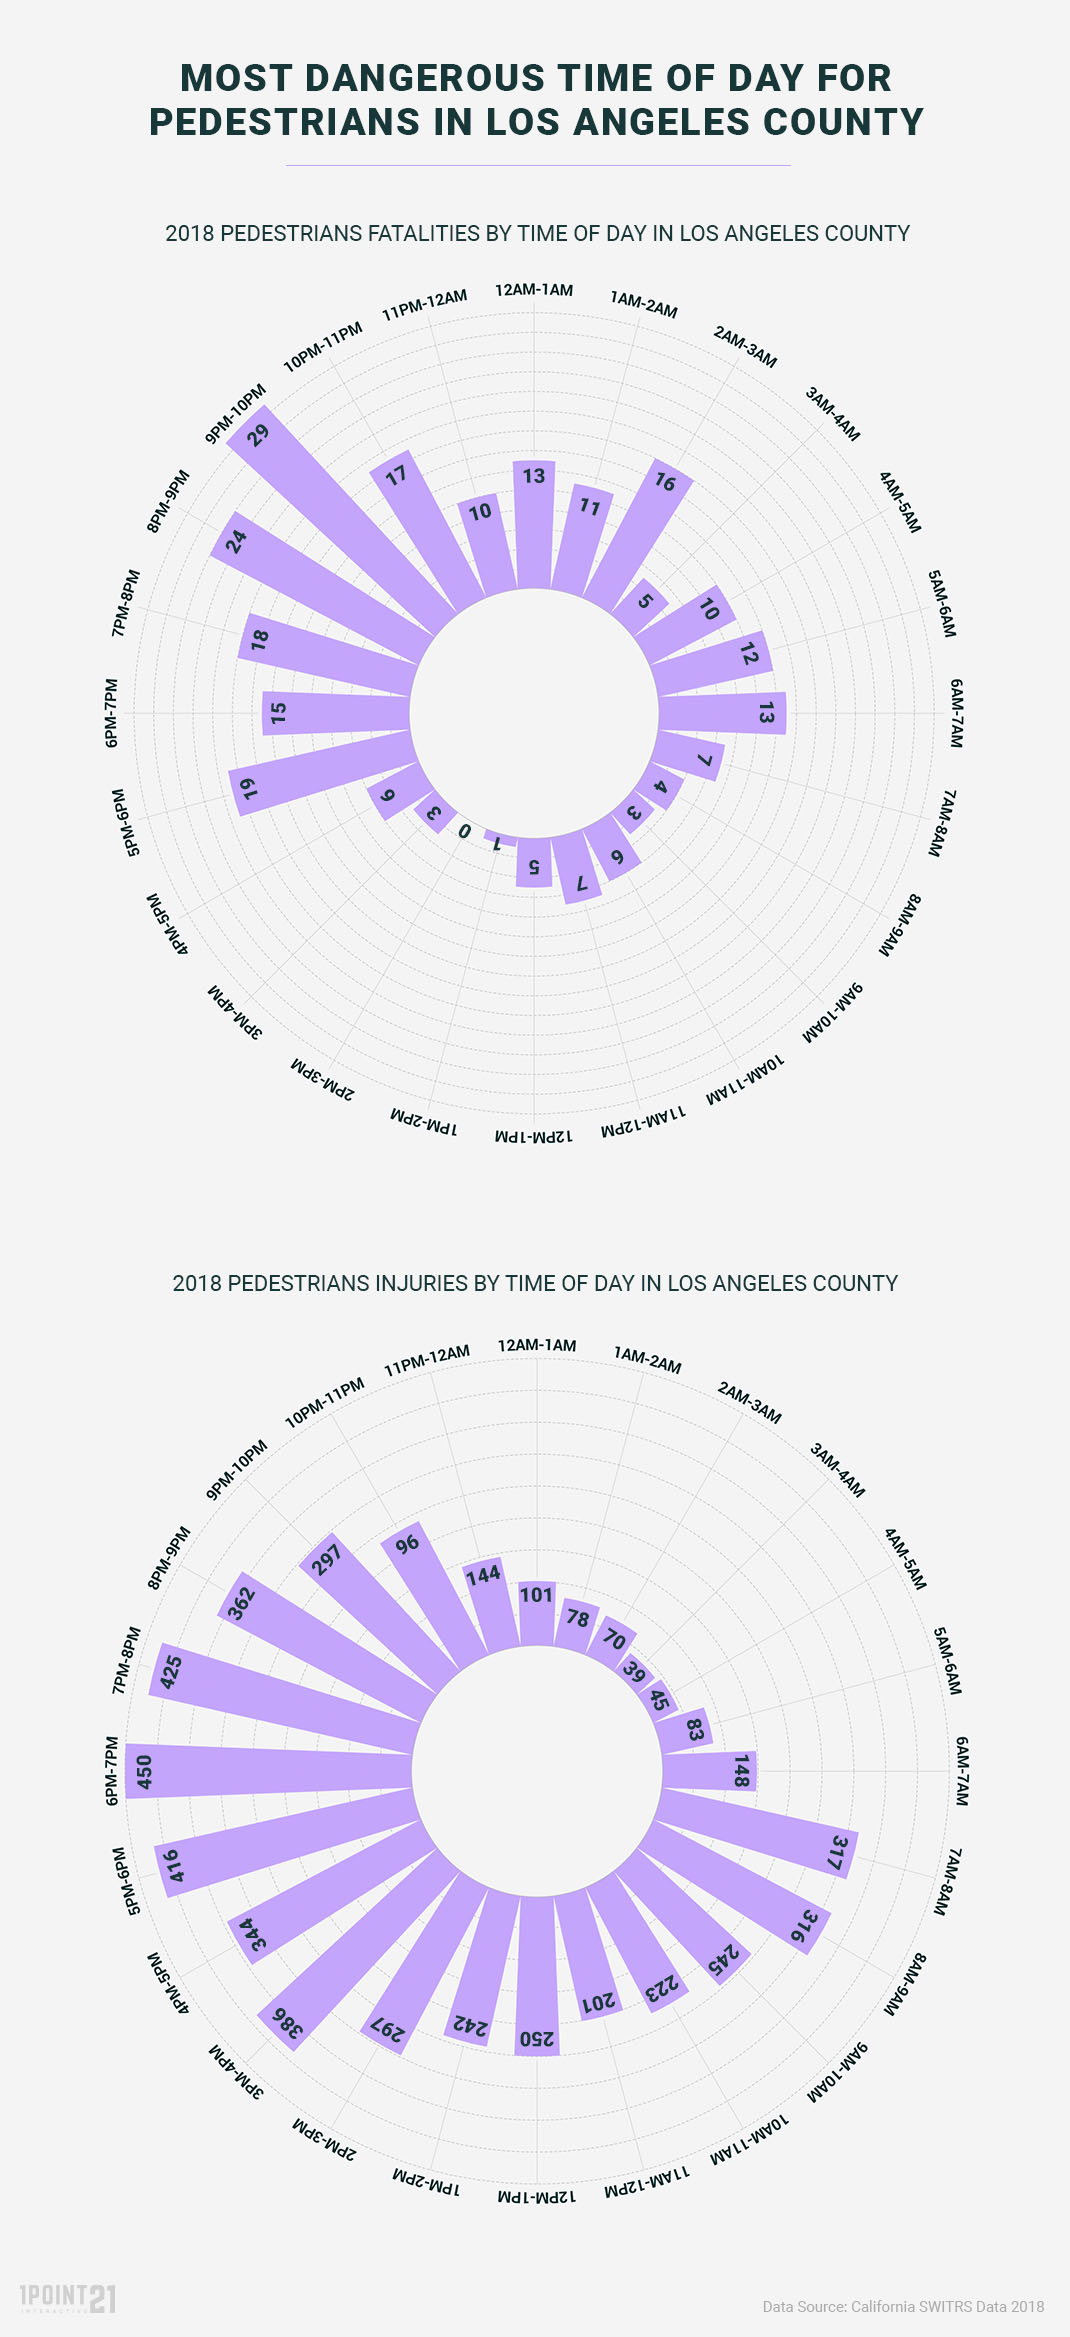
While we excel at creating data visualizations, the actual data is the most important part of any analysis. For this reason, we always include table data to allow readers to easily understand the results. Below is an example:
| TIME OF DAY | PEDESTRIANS KILLED | PEDESTRIANS INJURED |
|---|---|---|
| 12am-1am | 13 | 101 |
| 1am-2am | 11 | 78 |
| 2am-3am | 16 | 70 |
| 3am-4am | 5 | 39 |
| 4am-5am | 10 | 45 |
| 5am-6am | 12 | 83 |
| 6am-7am | 13 | 148 |
| 7am-8am | 7 | 317 |
| 8am-9am | 4 | 316 |
| 9am-10am | 3 | 245 |
| 10am-11am | 6 | 223 |
| 11am-12pm | 7 | 201 |
| 12pm-1pm | 5 | 250 |
| 1pm-2pm | 1 | 242 |
| 2pm-3pm | 0 | 297 |
| 3pm-4pm | 3 | 386 |
| 4pm-5pm | 6 | 344 |
| 5pm-6pm | 19 | 416 |
| 6pm-7pm | 15 | 450 |
| 7pm-8pm | 18 | 425 |
| 8pm-9pm | 24 | 362 |
| 9pm-10pm | 29 | 297 |
| 10pm-11pm | 17 | 237 |
| 11pm-12am | 10 | 144 |
Then, we created radial bar charts to illustrate exactly when pedestrians are most likely to be killed or injured in Los Angeles County. Plotting the fatalities and injuries separately keeps the visuals clean and simple, while clearly showing that pedestrians are disproportionately at risk of being killed later in the night.
More Analysis
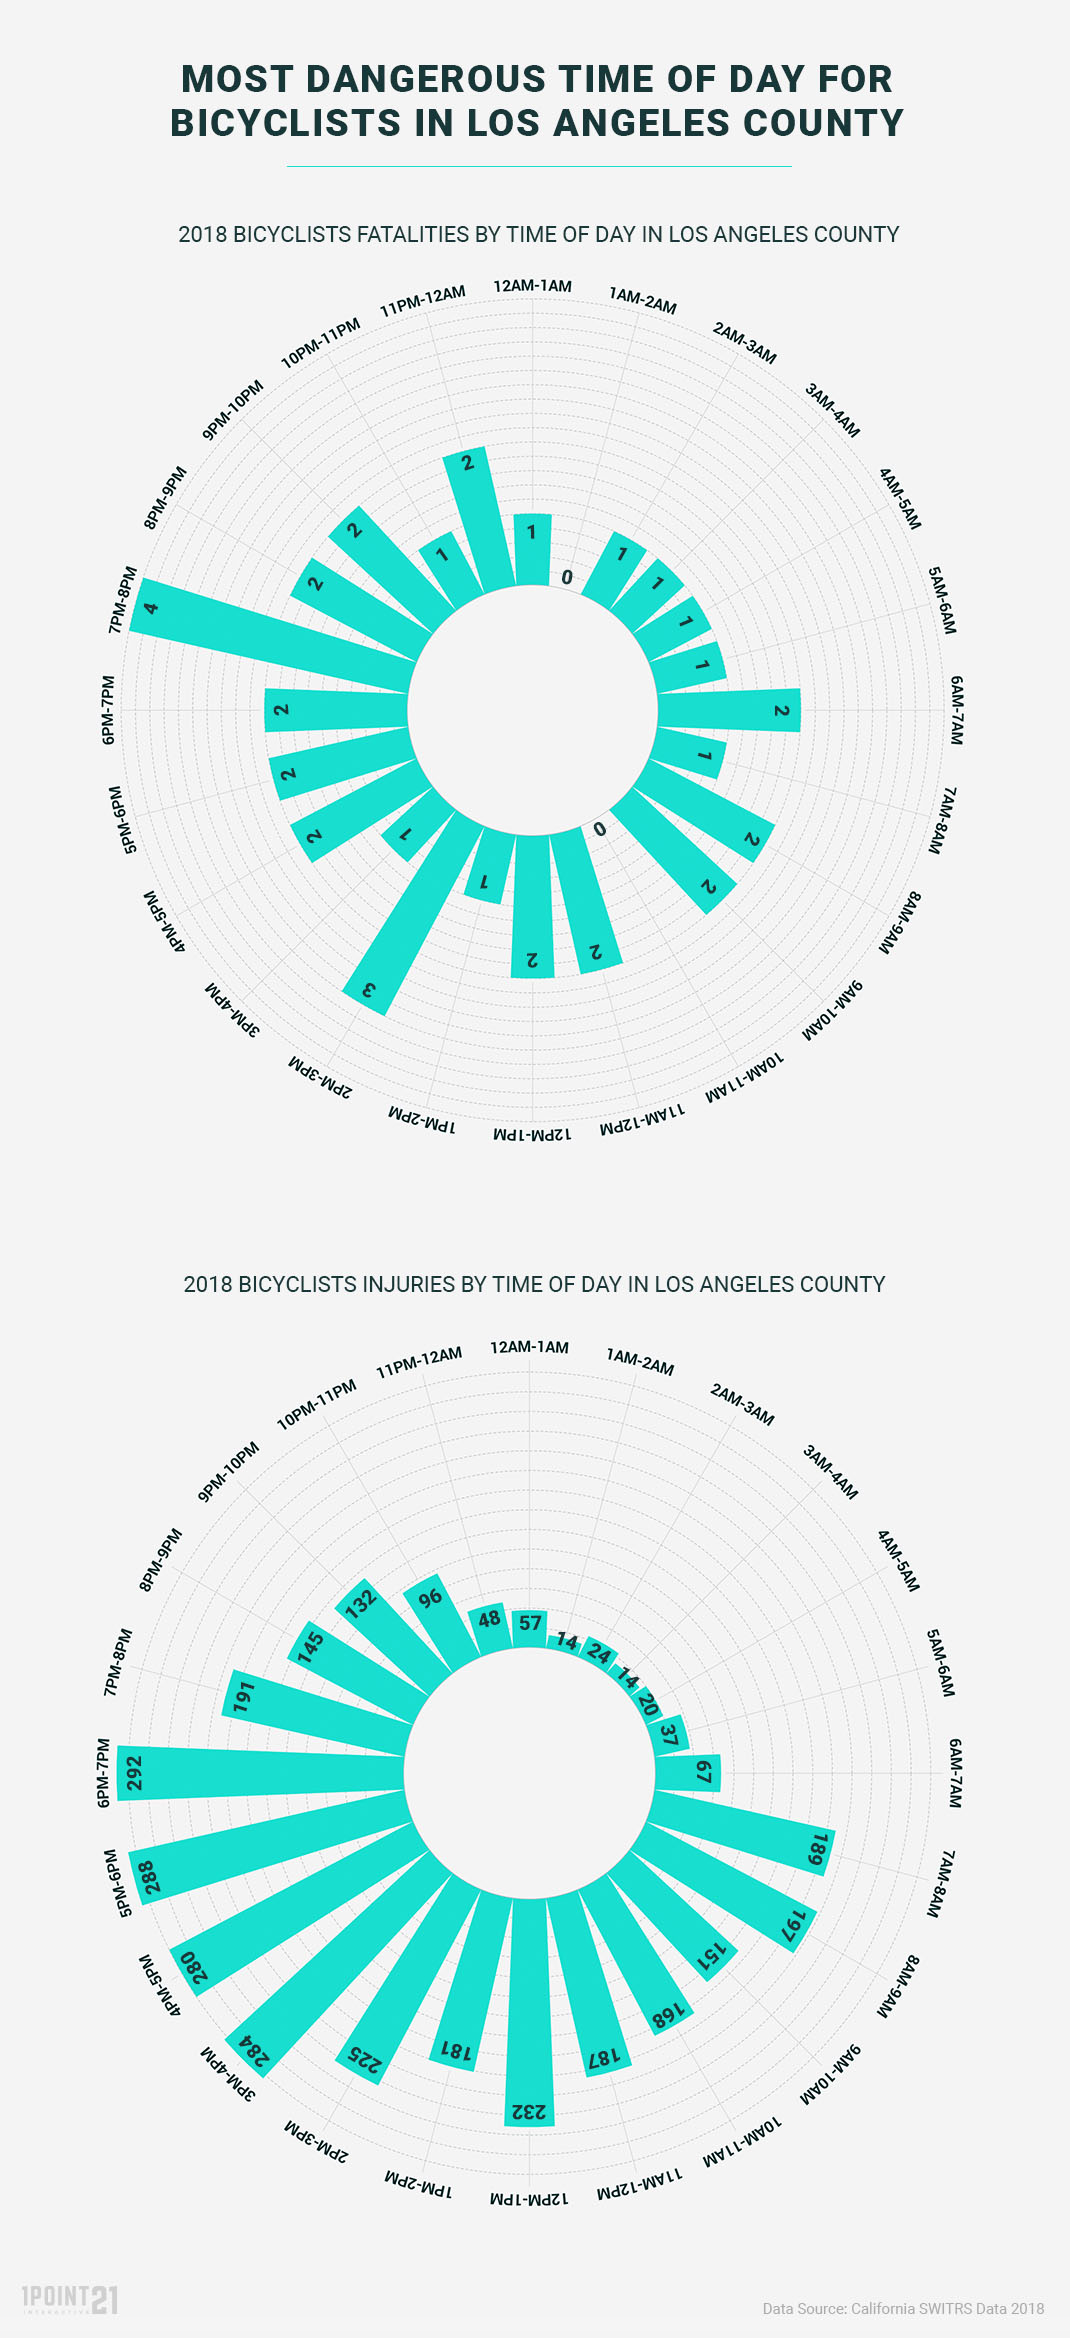
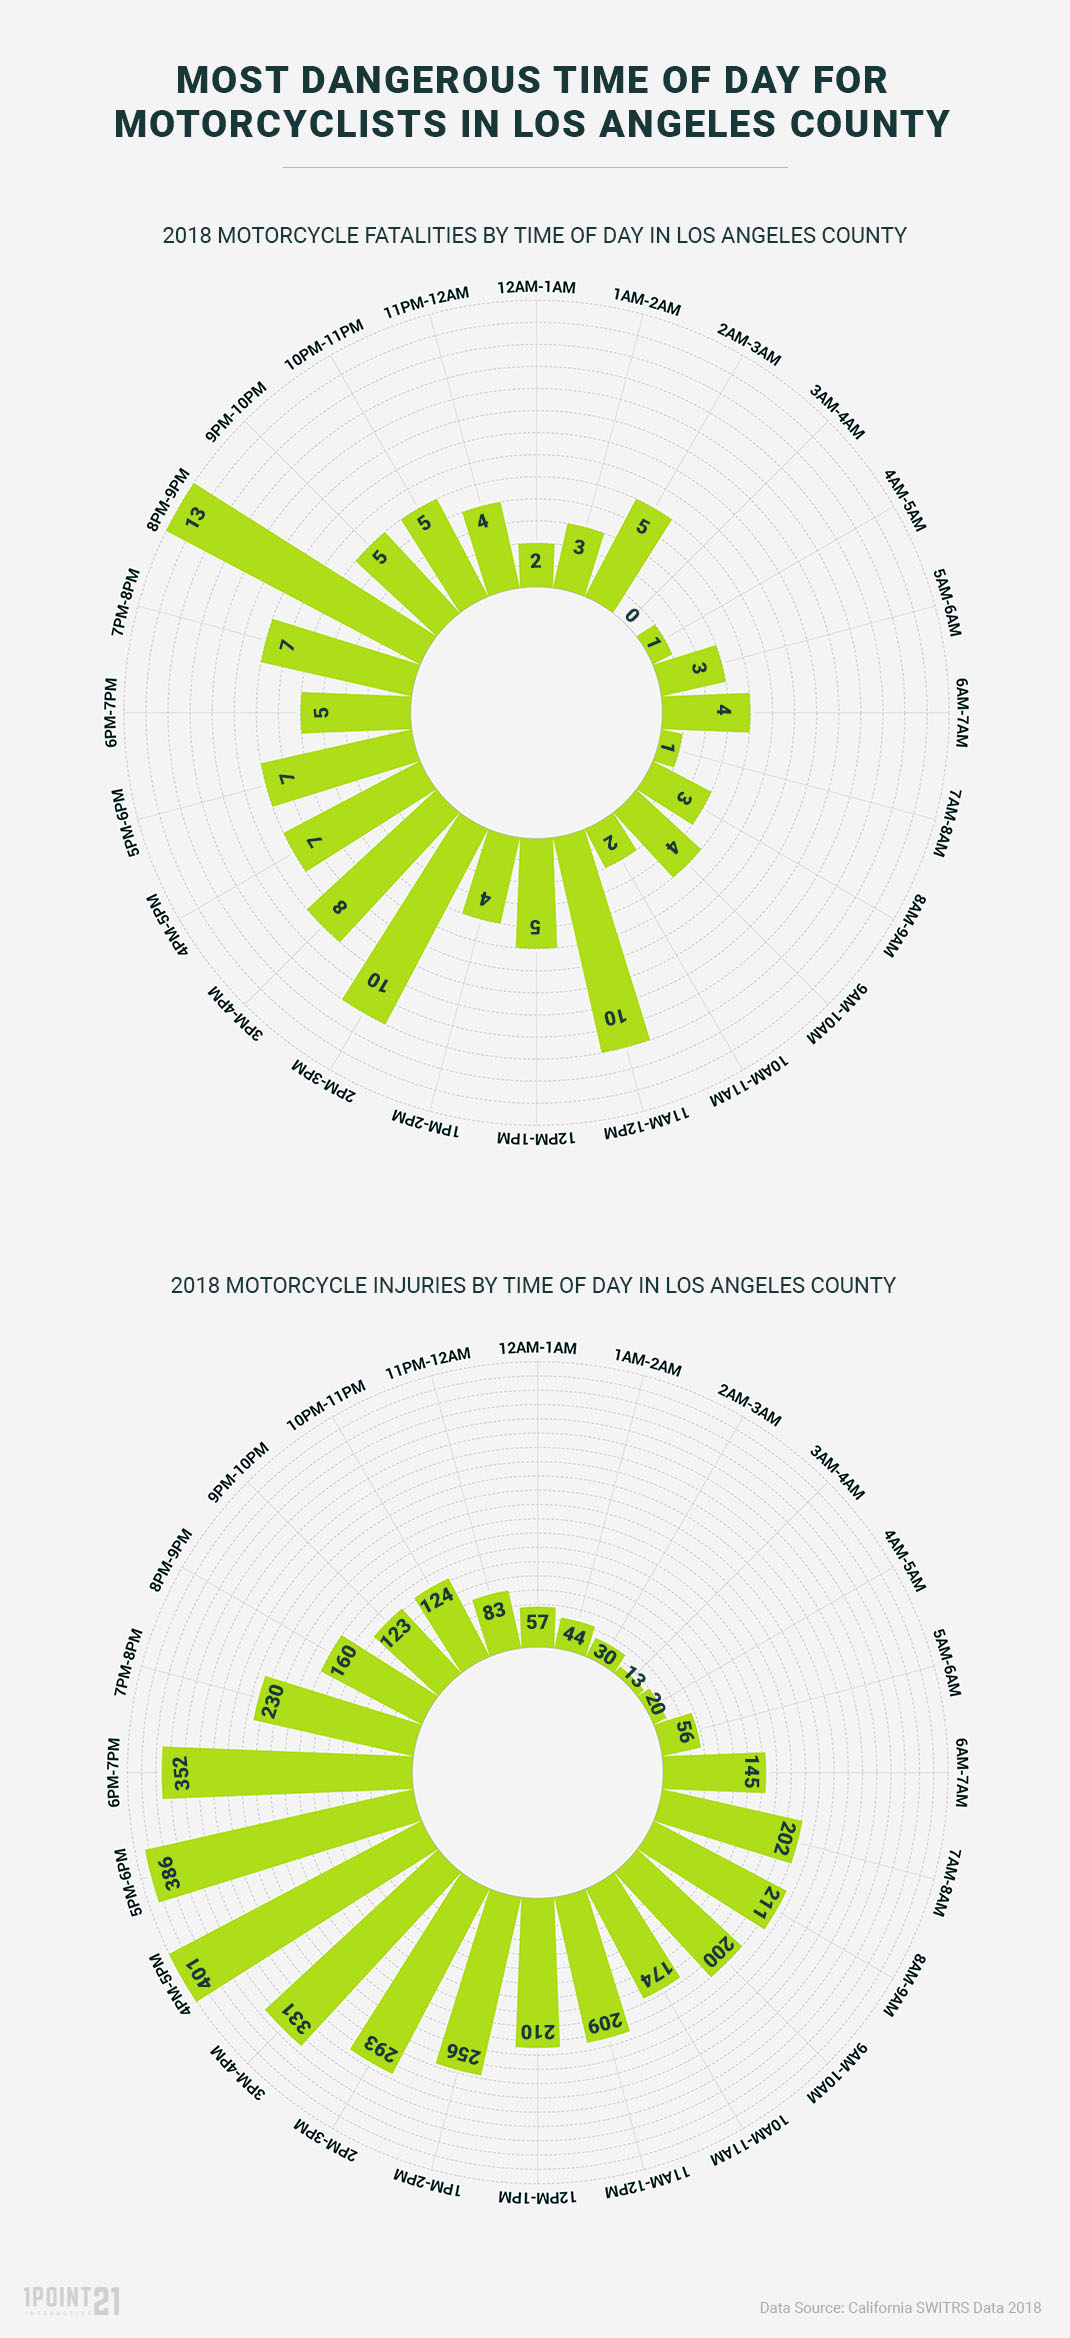
Since we had all the data, and we love to analyze and plot it, we also created radial bar charts for collisions involving two other types of vulnerable road users: bicyclists and motorcyclists.
Examining the data for the three types of road users side by side gives us a clear message for readers: don’t be a pedestrian in Los Angeles after 8 pm. It is vitally important to have a clear takeaway for reporters. This message gave us that takeaway along with actionable safety tips for readers and concerned citizens.
We are proud of our analysis and the work that we did for this client. We also thoroughly enjoy working with large datasets and creating striking visual content. If you have an idea for a project or want to work with us, drop us a line.